Summary
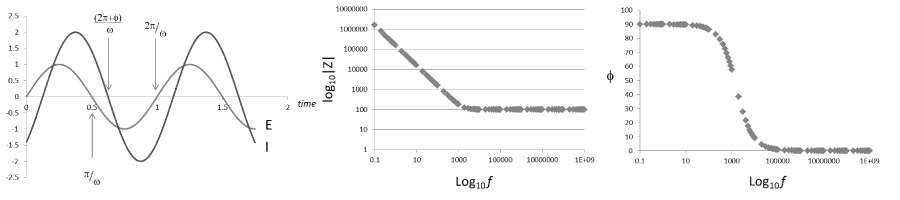
EIS measures the impedance of a system by applying a small sinusoidal voltage (or current) over a range of frequencies and recording the corresponding current (or voltage).
Experiment
- Sinusoidal voltage of ~ 10mV over a frequency range is applied
- Current response is recorded and the impedance calculated
- Bode plot and Nyquist plots constructed
Theory
- Impedance:
Impedance (complex)
Applied voltage
Measured current
Angular frequency
Real part, resistor like behaviour
Imaginary part, capacitive and inductive
Imaginary unit where
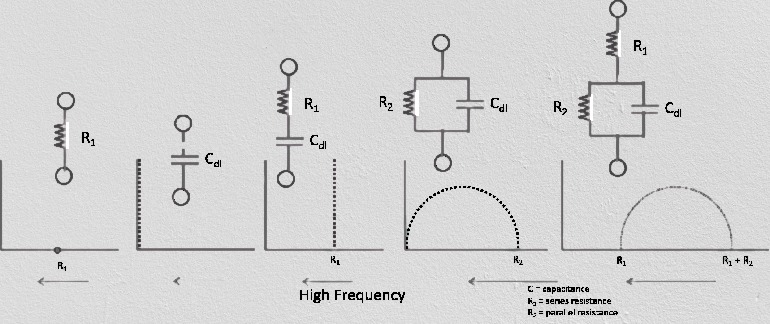
- Resistor:
- Capacitor:
Spectrum
- Nyquist Plot
- Real (X) vs. Imaginary (Y)
- Real (X) vs. Imaginary (Y)
- Warburg Impedance
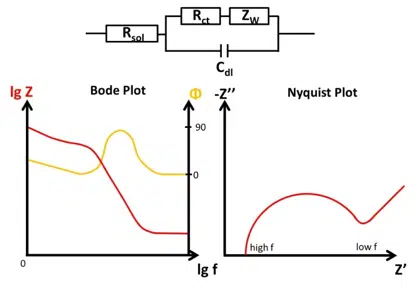
- Due to the movement of ions
- Bode Plots are
vs and vs : - Resistor in series with capacitor
- Resistor parallel with Capacitor
- Randles equivalent circuit
.jpg)
.jpg)
.jpg)